Asset Primer Overview: US Treasurys
By the Centrifuge Credit Group
When it comes to the fixed-income universe, there is nothing more foundational than the US Treasury market given its characteristics and size. According to the Financial Times, the US Treasury securities market is roughly $25 trillion in size today, five times what it was at the start of 2008. At $25 trillion, it is over 42% of the iShares Core US Aggregate Bond ETF and around 20% of the global fixed-income market.
The surge in onchain capital allocation toward the US Treasury market has been a focal point in the web3 landscape over the past two years. In this post, Centrifuge’s Credit Group provides an overview of this cornerstone market and explores the questions to ask when considering allocating to US Treasurys.
This Asset Primer Overview: US Treasurys covers:
- How does this giant and important market work?
- Who plays a significant role in supply and demand sides of the market?
- How are different segments of the market affected by the Fed?
- What are the different types of risks to consider?
What are US Treasurys?
US Treasurys are debt instruments issued by the US government to finance its activities. It is backed by the full faith and credit of the US government. Owing to the creditworthiness and status of the US as the world’s leading economy, the US Treasury market is often described as the “biggest, deepest and most essential bond market on the planet.”
Global investors view US Treasurys as risk-free and near-cash, meaning assets that retain their value and can be easily sold during both normal and stressed market periods. Note, the term “risk-free” in this post only refers to credit risk-free.
US Treasurys are also often used as benchmarks for other fixed-income securities around the globe. The further away you are from the risk profile of the US Treasurys, the bigger the premium you are required to pay to compensate investors for the additional jurisdictional, asset class, duration, and other risks.
To understand the US Treasury market, it’s important to understand the following fundamentals:
- Supply and demand
- Market segment and dynamics
- Market liquidity
- Market volatility and duration
- Maturity considerations
Supply and demand
First, a quick history refresh: The US Constitution gives Congress the ability to create a federal budget to determine how much money the government can spend for the upcoming fiscal year. Congress’s budget is then approved by the President. Every year, Congress decides the amount and the type of discretionary spending, as well as provides resources for mandatory spending.
On the supply side, the US Treasury Department is responsible for managing the country’s debt. Debt issuance is a core component of Treasury’s role as the manager of government operations, as it is needed when tax revenue collections are insufficient to meet the demand of federal obligations.
Legislative activity can affect the Treasury’s ability to issue debt and can impact the budget process. The US Congress sets a statutory limit on the permissible amount of federal debt, more commonly known as the debt ceiling, to control spending and impose a form of fiscal accountability.
Within the Treasury, the Office of Debt Management (ODM) makes all decisions related to debt issuance and the management of the United States debt portfolio. When federal spending exceeds revenues, the ODM directs the Bureau of the Fiscal Service to borrow the funds needed to finance government operations by selling securities to the public and government agencies through an auction process.
On the demand side, the market has traditionally been dominated by the Federal Reserve, foreign governments and commercial banks, though the percentage held by these entities has been trending down:

The declining share of Treasury debt seen from foreign holders has been picked up by the Federal Reserve (increasing from 16% to 22% from 2017 to 2022) and Other holders (increasing from 46% to 48% from 2017 to 2022). Other holders are primarily made up of pension funds, mutual funds and banking institutions:

As the biggest foreign buyers such as China trim their holdings and commercial banks stay on the sidelines, JPMorgan estimated that the 2023 buyers of these securities have shifted to hedge funds, mutual funds, insurers, and pensions which are attracted by the higher yields:

As the buyer group changes its main compositional mix, it bears watching what implications this shift in buyer profile will have on the market. For example, one may ask: Do they like to buy and hold or trade around? Will the market be more or less liquid and to what extent does that impact any one investor?
Market segments and dynamics
The US treasury market can be viewed through three buckets:
- Bills: 4, 8, 13, 17, 26, and 52 weeks in maturity. T-bills are issued at a discount from the par value of the bill. Purchasers get the full face value back at the end of maturity.
- Notes: 2, 3, 5, 7, and 10 years in maturity. Notes pay a fixed rate of interest every six months until they mature.
- Bonds: 20 and 30 years in maturity. Bonds pay a fixed rate of interest every six months until they mature.
At the end of October 2023, the split between these categories was approximately 30%, 60%, and 10% respectively.
While each segment has its own supply and demand dynamics, they are all influenced by short-term overnight borrowing costs, which in turn are influenced by the Federal Funds Rate (FFR) and Secured Overnight Financing Rate (SOFR). The Federal Open Markets Committee (FOMC) sets the FFR to guide overnight lending among U.S. banks. It’s set as a range between an upper and lower limit.
Customers deposit money at banks. Those deposits provide banks with the capital to extend loans and other forms of credit to their customers. Regulators require that banks and other depository institutions keep a certain percentage of their total capital in reserve at the Federal Reserve to help guarantee their stability and solvency. The amount of capital held by banks fluctuates day to day as deposits are added and withdrawn, and loans are approved and repaid. This means their reserve requirements are also constantly changing.
Banks often need to borrow money from other financial institutions overnight to meet regulators’ reserve requirements or they may want to lend out their excess reserve capital to their peers. The Federal Funds Rate provides a reference for institutions as they are borrowing or lending reserves.
From March 2022 to July 2023, the Federal Reserve has increased the Federal Funds Rate 11 times from 0.25% to 5.25% to tame inflation:

Source: Forbes
The Federal Reserve cannot force banks to adopt a particular rate. To support its policy objectives, the FOMC has established repo and reverse repo facilities.
Repos are a common secured money market transaction. In a repo transaction, the Fed Open Market Committee Desk purchases securities from a counterparty subject to an agreement to resell the securities at a later date. Each repo transaction is economically similar to a loan collateralized by securities and temporarily increases the supply of reserve balances in the banking system.
Conversely, in a reverse repo transaction, the Desk sells securities to a counterparty subject to an agreement to repurchase the securities at a later date. Reverse repo transactions temporarily reduce the supply of reserve balances in the banking system.
The Overnight Reverse Repo Facility (ON RRP) helps provide a floor under overnight interest rates by acting as an alternative investment for a broad base of money market investors when rates fall below the interest on reserve balances (IORB) rate.
Similarly, its Standing Repo Facility (SRF) serves as a backstop to dampen upward interest rate pressures that can occasionally emerge in overnight U.S. dollar funding markets (the SOFR market) and spillover into the fed funds market.
These mechanisms allow the Federal Reserve to effectively guide the lending cost on excessive reserves between banks to be within its FFR. This also effectively pins the short end of the US Treasury market very close to the Fed Funds Rate. The closer we are to the overnight rate, the closer the convergence:


While the SOFR number largely tracks the effective FFR, the correlation between the FFR and the longer maturities deteriorates quickly. For example, on December 11, 2023, the rates were:
- 5.33% for FFR
- 5.32% for SOFR
- 5.26% for a 3 month Treasury Bill
- 4.88% for a 1 year Treasury Bill
- 4.23% for a 10-year Treasury Note
The further we go out on the yield curve, the less arsenal the Federal Reserve has to exert influence and the more supply and demand forces play a role in determining the yield level.
For example, while the 3-month Treasury Bill yield has been pinned around the Federal Funds Rate, as recently as October 2023, the 10-year and 30-year Treasury Bonds were yielding close to 5% due to a variety of factors such as large issuance on the supply side and buyers wanting higher term premia on the demand side.

Market liquidity
Having a liquid market is essential for market participants in the world’s single biggest fixed-income asset class. Imagine an investor gets stuck with a position because there is no market liquidity for them to get out of their position when necessary. Whether the market has enough liquidity to timely and orderly support one’s entry and exit is an important question to consider.
Fortunately, with an average daily trading volume of $752.4 billion as of October 2023, the US Treasury market is the most liquid in the world on this measure.
However, there are more technical ways of measuring the liquidity in the market. According to the New York Federal Reserve Bank, liquidity typically refers to the cost of quickly converting an asset into cash and is measured in a variety of ways.
Two common measures to consider are:
- Bid-ask spreads: The difference between the lowest ask price and the highest bid price for a security
- Order book depth: The average quantity of securities available for sale or purchase at the best bid and offer prices

Source: New York Fed
The bid-ask spreads for all three maturities have marginally widened out in 2022, but have remained well below the levels observed during the COVID-related disruptions of March 2020. The widening has been greater for the 2-year Note relative to its average and relative to its level in March 2020. However, the overall impact remains small:

Source: New York Fed
Depending on anyone’s position size and execution ability, one should think about to what extent the amount they hold would be received by the market should a need to liquidate arise.
On the other hand, order book depth levels point to relatively poor liquidity in 2022, but with significant differences across maturities.
Depth in the 2-year Note has been at levels similar to that of March 2020, whereas depth in the 5-year Note has remained somewhat higher, and depth in the 10-year Note is noticeably higher than the levels of March 2020.

Source: New York Fed
The scatter chart above shows that the 2022 observations (in blue) largely fall in line with the historical relationship for the 5-year Note, meaning the current level of liquidity is consistent with the current level of volatility, as implied by the historical relationship between these two variables.
While the chart shows market liquidity may not be especially bad relative to volatility, one might then ask whether volatility itself is unusually high.
Market volatility and duration
We often hear that an individual bond price moves in the opposite direction as its yield. In other words, bond prices increase when interest rates decline and decrease when interest rates go up. The extent to which a bond’s price fluctuates due to changes in interest rates is called its volatility.
In global fixed-income Nuveen’s own words, a bond’s price volatility depends on two factors– its coupon rate and maturity.
- The lower the coupon rate, the greater the price volatility.
- The longer the maturity, the greater the price volatility.
If two bonds have the same maturity, the lower coupon bond will be more volatile. If two bonds have the same coupon rate, the one with the longer maturity will be more volatile. When it comes to comparing the volatility of two bonds with different coupon rates and maturities, we use duration.

Duration equals the sum of the present value of each payment multiplied by time until that payment is received, divided by the price of the bond. Duration is measured in years. In general, the longer the duration – or the longer you need to wait for the payment of coupons and return of principal, the more its price will drop as interest rates rise.
Using the BlackRock approximation method, for every 1% increase or decrease in interest rates, a bond’s price will change approximately 1% in the opposite direction for every year of duration.
For example, a 1% increase in interest rate may lead to approximately a 1% decrease in a 1-year Treasury Bill, but close to a 9% decrease in a 10-year Treasury Bond price.
While duration is a useful way of thinking about individual Treasury Bonds or a group of Treasury Bonds with similar maturity dates, to get an idea of the volatility across the whole Treasury market, we can use the ICE BofAML MOVE Index.
ICE BofAML MOVE Index is a measure of expected short-term volatility in the US Treasury Bond market. It is a market-implied measure of bond market volatility. It calculates options prices to reflect the expectations of market participants on future volatility.
The Index uses options prices on Treasury Bond futures from 2, 5, 10, and 30 years to calculate a weighted average value. The average can range anywhere from 0 to 260.
A high MOVE Index value is interpreted to mean an increase in Treasury market volatility and potentially heightened risk and uncertainty. And a low value signals the opposite.

Source: Financial Times
The broader Treasury market experienced severe volatility as the Fed’s hiking cycle upended the market as indicated by the MOVE Index surging from 80 at the beginning of 2022 to 170 at the start of 2023. The current Index level of 118 still indicates higher than average volatility level.
One needs to take a view if volatility will stay at this relatively high level or if it will return to the halcyon days of 2020. A highly volatile market makes bonds with longer duration a riskier bet than bonds of shorter duration.
Maturity considerations
According to the Financial Times, investors poured $1 trillion into global money market funds in 2023– a trend concentrated in the US.

The trillion-dollar surge in inflows since the Federal Reserve started its rate hiking cycle in 2021 is only matched by the dramatic outflow following the Great Financial Crisis of 2008 as the Federal Reserve cut FFR from 5.25% to 0%.
However, while the shorter end of the yield curve benefited from the Federal Reserve’s hikes, as these Treasury Bills matured within a year or less with higher yields, the longer-dated Treasury Bills didn’t fare so well. The belly of the curve suffered some losses due to their longer duration, but the brunt of the damage was borne by the longer-dated Treasurys.
According to Bloomberg, losses on longer-dated Treasurys rival some of the most notorious market meltdowns in US history. Bonds maturing in 10 years or more have slumped 46% since peaking in March 2020. That’s just shy of the 49% plunge in US stocks in the aftermath of the dot-com bust at the turn of the century. The rout in 30-year bonds has been even worse, tumbling 53%, nearing the 57% slump in equities during the depths of the financial crisis.
The table below is a comparative study of returns of different duration bond ETFs:

The longer the maturity, the larger the loss due to FFR leaping from 0.25% to 5.5% affecting the treasury prices:
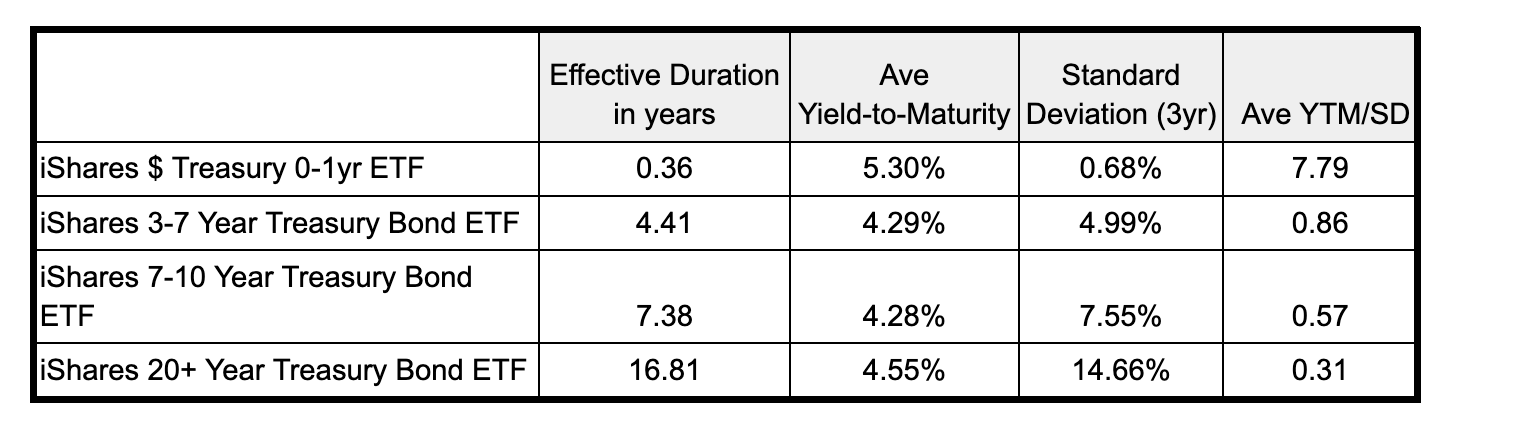
Using historical measures of performance and risks, the short-end maturities offered the best risk-adjusted return. The high yield and short duration nature of the shortest maturity Treasury Bills have made them a very attractive place for investors to park their capital in exchange for a risk-free rate since 2021.
However, this outcome is contingent on the Federal Reserve pinning the front end of the yield curve at a high level and maintaining a higher for longer policy stance while the economy remains resilient.
Consider a case where the front-end yield falls to 3% from 5.25%. There is not only substantial re-investment risk associated with the short-dated Treasurys, but they also miss out on the price appreciation associated with the duration effect.
For example, the iShares 7-10 Year Treasury Bond ETF will gain close to 15% in price. This is in addition to its 4.28% average yield. In this scenario, the 0-1-year ETF would not enjoy such an upside.
Just as the longer-dated Treasurys bore the brunt of the damage when the Federal Reserve raised rates, when they eventually cut rates, the longer end will enjoy convexity but this time to the upside. But of course, the Federal Reserve may stick to higher for longer and keep rates where they are.
Having a view of the Federal Reserve’s policy stance and potential future path is essential in informing one’s allocation strategy. Of course, the future is uncertain. And that is all the more reason to assign different weightings to different maturities and look towards a diversified portfolio. Having a diversified maturity profile within one’s Treasury portfolio can provide exposure to both the upside of longer-dated Treasurys in the case of eventual rate cuts and the high coupons of short durations while the Federal Reserve assesses incoming economic data and ponders its best policy step.
Crafting your investment mandate
As with any asset class, remember to always ask yourself: Does this particular asset offer the best return per unit of risks taken?
While the US Treasury can serve as a foundational pillar in one’s portfolio, it is a complex and nuanced market with a wide variety of participants each exerting an influence on the market.
Allocating towards this asset class requires a careful assessment of a variety of risk factors such as liquidity, volatility, duration, and the Federal Reserve’s likely interest rate path.
A well-balanced portfolio requires a deeper level of thinking that goes beyond short-term benefits and plans out an all-weather portfolio that can thrive in market volatility and uncertainties.
Disclaimer:
This post does not constitute or offer legal, tax, commercial or other advice and users of the post should not rely on it as such advice. Although care has been taken as to what is contained in the post, no attempt has been made to give definitive or exhaustive statements of law or any opinions on specific legal, tax or commercial issues and no representation is made or warranty given that the information is complete or accurate.
As more legislation and regulatory guidelines are issued or updated, the accuracy of the information contained in the post may alter. Anyone requiring advice on any of the matters referred to herein should consult lawyers or other professionals familiar with the appropriate jurisdiction and legislation.
Nothing contained in this post is to be construed as a solicitation or offer, or recommendation, to buy or sell any interest in any note or other security, or to engage in any other transaction, and the content herein does not constitute, and should not be considered to constitute, an offer of securities. No statement herein made constitutes an or to sell or a solicitation of an offer to buy a note or other security.